Table of Contents
Maurer Rose
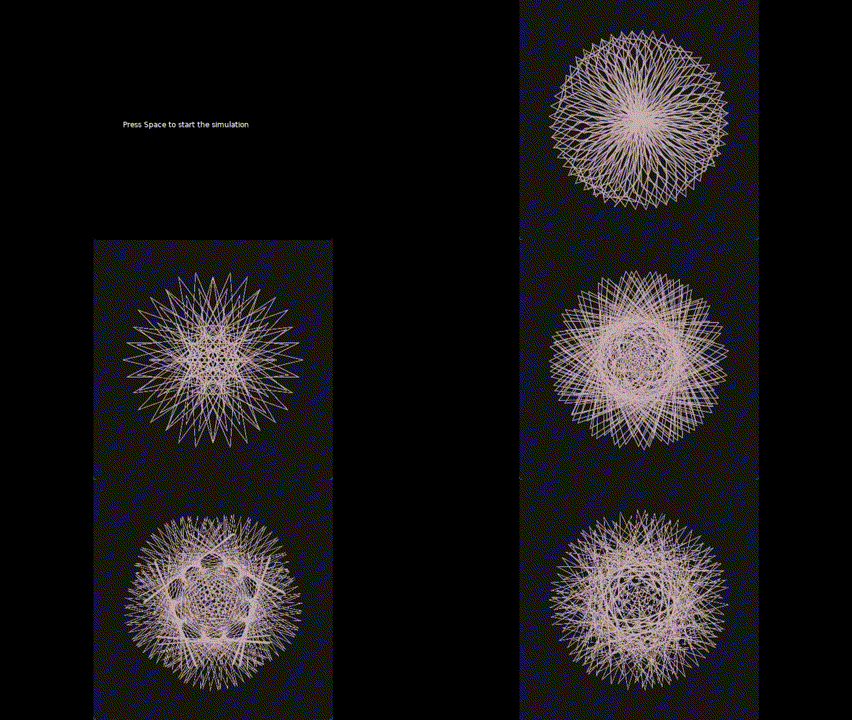
A Maurer Rose is a curve which connects points on a Rose Curve. A Rose Curve in turn is a sinusoid function plotted using Polar coordinates.
I've built this simulation while following another of "The Coding Train" videos - "Coding the Maurer Rose".
The code for the simulation is at my github as usual - Maurer Rose Simulation in Love2d. The main.lua file is also provided for reference at the bottom of this post.

Code
main.lua
--- main.lua: A Maurer Rose Simulation in LÖVE
-- date: 4/3/2024
-- author: Abhishek Mishra

local n
local d

local running = false

--- love.load: Called once at the start of the simulation
function love.load()
    n = 0
    d = 0
end

--- love.update: Called every frame, updates the simulation
function love.update(dt)
    if not running then
        return
    end
    n = n + 0.01
    d = d + 0.05
end

--- love.draw: Called every frame, draws the simulation
function love.draw()
    -- if not running, display the message to start the simulation
    if not running then
        love.graphics.print("Press Space to start the simulation", 50, love.graphics.getHeight() / 2)
        return
    end

    love.graphics.push()
    love.graphics.setBackgroundColor(0.1, 0.1, 0.1)

    love.graphics.translate(love.graphics.getWidth() / 2,
        love.graphics.getHeight() / 2)

    local points = {}

    for i = 0, 361 do
        local k = i * d
        local r = 150 * math.sin(math.rad(n * k))
        local x = r * math.cos(math.rad(k))
        local y = r * math.sin(math.rad(k))
        table.insert(points, x)
        table.insert(points, y)
    end

    love.graphics.setColor(0.8, 0.7, 0.7)
    love.graphics.setLineWidth(0.1)
    love.graphics.line(points)

    -- uncomment to trace the main Rose Curve path
    -- points = {}

    -- for i = 0, 361 do
    --     local k = i
    --     local r = 150 * math.sin(math.rad(n * k))
    --     local x = r * math.cos(math.rad(k))
    --     local y = r * math.sin(math.rad(k))
    --     table.insert(points, x)
    --     table.insert(points, y)
    -- end

    -- love.graphics.setColor(0.9, 0, 0.9, 0.5)
    -- love.graphics.setLineWidth(4)
    -- love.graphics.line(points)

    love.graphics.pop()
end

-- escape to exit
-- press space to toggle the simulation
function love.keypressed(key)
    if key == "escape" then
        love.event.quit()
    end
    if key == "space" then
        running = not running
    end
end